Inhalt
Seite 1
MotivationSeite 2
Literature on Pandemics and Real Estate MarketsSeite 3
Empirical Analysis and ResultsSeite 4
Conclusion, References and IWH European Real Estate Index (EREI) Auf einer Seite lesenEmpirical Analysis and Results
The focus of this note are the first-order effects of COVID-19 casualties on price dynamics in regional real estate sales and rental markets in Europe. To test for according statistical relationships, we regress COVID-19 cases on sale and rental prices per square meter (abbreviated by Y) for the different EU member states using the following specification:
Yrt = αr + αt + βCr,t−1 + ϵrt, (1)
where C indicates the monthly average number of daily cases per 10,000 inhabitants in a NUTS-3 region, r refers to NUTS-3 regions per country, and t indicates calendar months. The sample period covers all months for which we have price information from January 2020 until December 2021. αr and αt are region and time fixed effects. We focus on estimating β, which provides the sensitivity of prices per square meter to differences in COVID-19 cases in the previous month Cr,t-1 in a particular NUTS-3 region. We follow Naqvi (2021) and use the most recent measure from the Github repository of the COVID-19-European-Regional-Tracker.

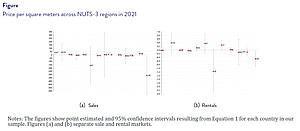
The Figure presents β coefficients that we estimate for each country separately by running regressions of Equation (1). Figure (a) shows results when we use sales prices per square meter as the dependent variable. The point estimates and their precision vary widely across countries. Only for the United Kingdom (UK) we find significant effects at the 5% level. The point estimate equals approximately ‒275, which means that on average if we compare two NUTS-3 regions in the UK, which differ by one case per 10,000 people, the sales price per square meter in the region with more cases has decreased by 275 Euros. According to the Local Authority Building Control, the average dwelling in the UK is around 67 square meters. If we compare the mean region in terms of daily cases with the region at the 75 percentile (the difference is 1.58) on the basis of our estimates, houses in more affected regions lost on average about 275 × 67 × 1.58 ≈ 30,000 Euros in value.
Regarding rental markets, we find similar effects in Figure 1(b). For most countries, daily cases have no significant effect on rents per square meter. Again, the UK stands out since we find a significant β coefficient of around ‒0.45. With the same comparison, renters have to pay on average −0.45 × 67 ≈ −30 Euros less for every daily case. Moreover, Figure 1(b) shows that the results for Italy oppose those obtained for Britain. For Italy, the estimate is around 0.25. According to Idealista, the average surface area of a dwelling in Italy is 81 square meters. Our estimates therefore imply that for every additional monthly case per 10,000 inhabitants, renters need to afford on average 0.25 × 81 ≈ 20 Euros more for their rent. We also find significant effects for Estonia, but the economic magnitude of the effects implied by the coefficient is negligible.


