Economic Mobility Likely to Increase Significantly after Relaxation – but also Number of COVID-19 Cases
In Deutschland wurden Anfang März in einigen Bereichen Maßnahmen zur Eindämmung des Coronavirus gelockert; so wurde die Anzahl der Personen aus verschiedenen Haushalten, die sich treffen dürfen, vielerorts erhöht und Einzelhandelsgeschäfte können vermehrt wieder Kunden empfangen. Auf diese Weise kommt es zu einem gewollten Wiederanstieg der wirtschaftlichen Mobilität und der persönlichen Kontakte zwischen Menschen. Die Kontakthäufigkeit ist allerdings auch ein wesentlicher Einflussfaktor für die Ausbreitungsgeschwindigkeit des Coronavirus, zumal die Lockerungen bislang nicht mit einer systematischen Teststrategie einhergehen; und auch der Impffortschritt bleibt hinter den Erwartungen zurück. Schätzungen auf Basis eines Modells für den Zusammenhang zwischen Eindämmungsmaßnahmen (Oxford COVID-19 Government Response Tracker, Stringency Index), wirtschaftlicher Mobilität (Google Mobility Data), Corona-Neuinfektionen und Todesfällen mit Daten aus 44 Ländern deuten darauf hin, dass die jüngsten Lockerungen die wirtschaftliche Mobilität um mehr als zehn Prozentpunkte ansteigen lassen und die Zahl der Neuinfektionen und der Todesfälle in Deutschland um 25% erhöhen. Da sowohl ein fortgesetzter Lockdown als auch Lockerungen erhebliche negative Konsequenzen mit sich bringen, ist es umso wichtiger, durch eine bessere Test- und Quarantänestrategie und durch eine höhere Geschwindigkeit beim Impfen weitere Lockerungen zu ermöglichen, ohne damit die Gesundheit der Menschen zu gefährden.
18. March 2021
Introduction
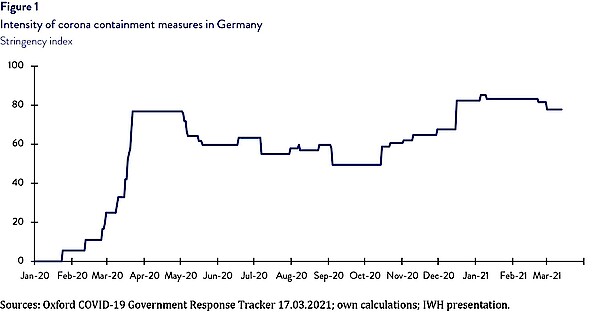
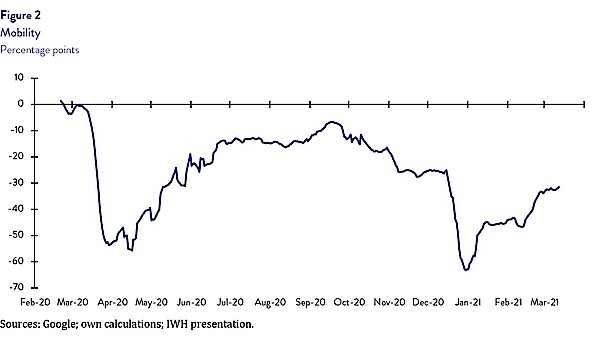
To contain the spread of coronavirus, many countries have implemented restrictions on mobility and public life. Examples of such measures include school and business closures, cancellation of major events, restrictions on freedom of assembly, closure of public transport, curfews, and restrictions on national and international travel. The overall intensity of these measures, as measured by the Oxford COVID-19 Government Response Tracker (Stringency Index), rose to a high level in Germany in the wake of the first wave of infection in spring 2020 (see figure 1). In the summer of 2020, some measures were withdrawn or relaxed. Since mid-October 2020, measures have been tightened again: Restaurants were closed in November; large parts of the retail sector and general education schools in mid-December. Mobility, which is also important for many economic activities, reflects the level of containment measures (see figure 2).
Empirical evidence demonstrates that, on the one hand, public life restrictions are likely to mitigate the number of new corona infections; however, ever further containment measures tend to have smaller and smaller effects on the number of new infections (Bendavid et al. 2021)1 and on the number of deaths. On the other hand, containment measures affect economic activity; the longer containment measures last and the more intensive they are, the higher the direct economic costs of containment policies. For example, lost sales can lead to corporate bankruptcies (Holtemöller and Muradoglu 2020)2. Thus, there is a certain trade-off between reducing deaths and serious disease progression and avoiding economic losses.3 However, this does not mean that it is not optimal from an economic perspective in the medium to long term to accept some level of income loss associated with containment measures (Holtemöller 2020)4. But it does mean that the various effects must be weighed against each other when deciding whether to take or withdraw containment measures.
Relaxations and increasing corona cases
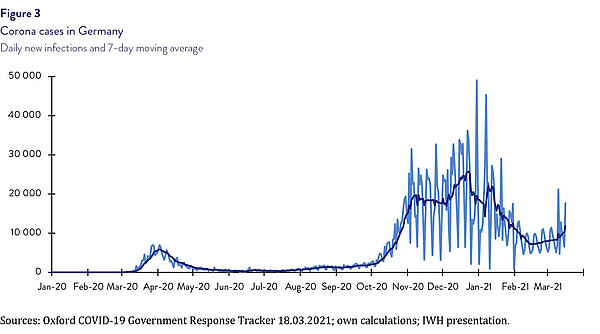
In Germany, there is currently intensive discussion about relaxing containment measures. There has already been a relaxation in some areas; for example, face-to-face classes are once again being held in schools in many places, albeit with restrictions, and retail stores are increasingly able to receive customers again. This allows for a resurgence of mobility and personal contact between people. However, the frequency of contact is a major factor influencing the rate at which the coronavirus spreads. The relaxations are not yet accompanied by a systematic testing strategy; and vaccination progress has so far fallen short of expectations. Indeed, recent data thus suggests an increase in mobility (see figure 2) and, at the same time, an accelerated increase in new infections (see figure 3).
The extent to which the current relaxations are increasing economic mobility and the incidence of infection in Germany can be estimated using the empirical relationship between containment measures, economic mobility, and new infections from the past. To do so, we use the model of Camehl and Rieth (2021)5.6 We simulate a counterfactual scenario without the early March relaxations, i.e., the stringency index is held constant in this hypothetical scenario. We contrast this with a scenario in which the stringency index falls by 5%, which is roughly equivalent to its decline in early March. The difference between these two scenarios is shown in figure 4.
Compared with the alternative scenario without easing, the stringency index falls below its initial level for just under two weeks. The easing is associated with a rapid increase in economic mobility. Over the course of the first week, it rises steadily, by as much as ten percentage points. It remains about a month above the level it would have been if the easing had not been implemented. The increased mobility enables more economic and social activity again, so that the negative consequences of the lockdown, for example in the area of education or culture, are mitigated and the economic situation of the affected companies can stabilise again.
However, the increase in economic mobility is accompanied by significantly more new infections. While the increase in cases is initially small due to incubation period, the number of cases continues to rise over the course of the first few weeks compared with the alternative scenario without relaxation. The peak is reached after about a month and amounts to about a quarter more infected persons than without the relaxations. Only gradually do the numbers of cases start to decline again. Even after two months, they are still higher than they would have been without the relaxations.
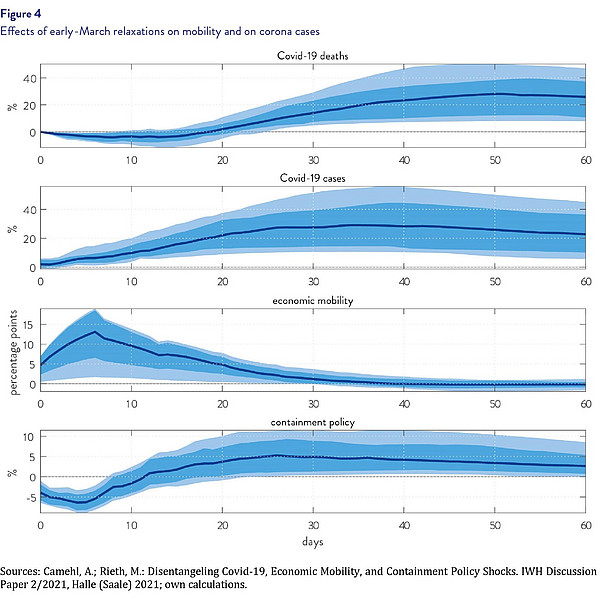
With a delay of about three weeks, the additional new infections become noticeable in the number of deaths. There is a substantial increase in the number of people who die in association with COVID-19. The increase is proportional to the increased number of infected persons and is approximately 25% after six weeks. Even after two months, deaths are still significantly above the trend in the alternative scenario without relaxations.
Economic policy implications
The easing of containment measures is already showing its first traces in the data. Both economic mobility and the number of confirmed COVID-19 cases have increased markedly in recent days. Our estimates suggest that the number of new infections in the coming weeks is likely to be 25% higher than the number of cases expected without the recent relaxations. However, the increase in economic mobility by more than ten percentage points also allows for more economic and social activity, so that the negative consequences of the lockdown are mitigated. The model employed in the study can be used to quantify this short-term trade-off; this provides policymakers with an important basis for decision-making. Because both continued lockdown and relaxation have significant negative consequences, it is even more important to allow further relaxation through better testing and quarantine strategies and by increasing the pace of vaccination without compromising human health.
Appendix - Empirical model
To estimate the relationship between economic mobility, infected persons and deaths, a Bayesian panel model in the form of a structural vector autoregression is used (Camehl and Rieth 2021). It includes five variables: cumulative COVID-19 deaths, cumulative COVID-19 infections, a containment index, an economic mobility index, and a small business stock price index. All variables except the mobility index are in logarithms and enter the model in levels. There are 14 lags used in the model. The high number of lags allows for reliable forecasts for several months. To have enough observations to estimate the high number of model parameters, data for 44 countries are used. These countries represent about 80% of the world's infected and deaths and three quarters of global production.
The structural containment policy shock is identified by using sign restrictions (Arias et al. 2018)7. It is assumed that an unexpected relaxation of containment measures lowers the stringency index in the model. Furthermore, this relaxation is assumed to lead to an increase in economic mobility and an increase in the number of infected people after seven days at the latest. However, the exact dynamics and magnitude of these increases emerge from the estimation and depend on the size of the relaxation, i.e., the size of the shock.
Endnotes
1 Bendavid, E.; Oh, C.; Bhattacharya, J.; Ioannidis, J. P. A.: Assessing Mandatory Stay-at-Home and Business Closure Effects on the Spread of COVID-19, in: European Journal of Clinical Investigation, 2021.
2 Holtemöller, O.; Muradoglu, Y. G.: Corona Shutdown and Bankruptcy Risk. IWH Online 3/2020. Halle (Saale) 2020.
3 In addition to the economic costs of containment measures, other effects, such as on mental health, children's developmental opportunities, or educational inequality, play an important role in the overall societal assessment.
4 Holtemöller, Oliver: Integrated Assessment of Epidemic and Economic Dynamics. IWH Discussion Paper 4/2020. Halle (Saale) 2020.
5 Camehl, A.; Rieth, M.: Disentangeling Covid-19, Economic Mobility, and Containment Policy Shocks. IWH Discussion Paper 2/2021. Halle (Saale), 2021.
6 A short non-technical description of the model can be found in the appendix.
7 Arias, J. E.; Rubio-Ramírez, J. F.; Waggoner, D. F.: Inference Based on Structural Vector Autoregressions Identified with Sign and Zero Restrictions: Theory and Applications, in: Econometrica, 86, 2018, 685-720.


