Info Graphs
Sometimes pictures say more than a thousand words. Therefore, we selected a few graphs to present our main topics visually.
If you should have any questions or would like to request the original material, please do not hesitate to contact Wolfgang Sender.
Info Graphs
A Turning Point for the German Economy?

The international political environment has fundamentally changed with looming trade wars and a deteriorating security situation in Europe. According to the spring forecast of the Halle Institute for Economic Research (IWH), gross domestic product in 2025 is likely to be roughly the same as in the previous year, and it will not increase significantly until 2026 (Data: March 11, 2025).
New Regulatory Framework in Europe
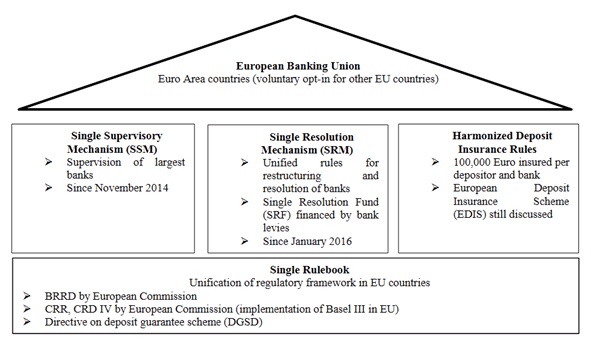
This figure shows the different pillars that form the basis of the new regulatory framework in Europe. The Single Rulebook applies to all 28 member states. The three pillars of the European Banking Union are obligatory for Euro Area countries and voluntary for the remaining EU member states. Source: Koetter, Michael; Krause, Thomas; Tonzer, Lena (2017): Delay determinants of European Banking Union implementation. IWH Discussion Papers 24/2017, Halle Institute for Economic Research (IWH).
Share of Zombie Firms 2010-2014 by Country
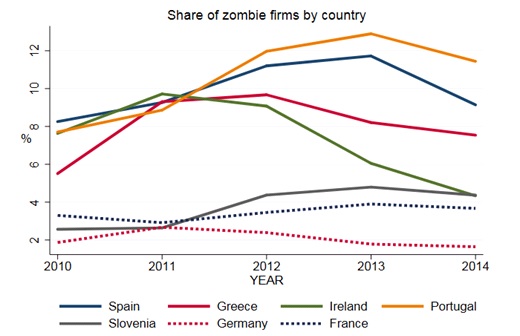
The graph shows the percentage share of firms that have been classified as zombies in a given year and country. Zombie firms are firms, that for at least two consecutive years have negative returns, negative investment, and debt servicing capacity (EBITDA/ financial debt) below 5 %. Source: Koetter, Michael; Setzer, Ralph; Storz, Manuela; Westphal, Andreas (2017): Do we want these two to tango? On zombie firms and stressed banks in Europe. IWH Discussion Papers 13/2017, Halle Institute for Economic Research (IWH).
Comparison of EFN Forecasts with Alternative Forecasts
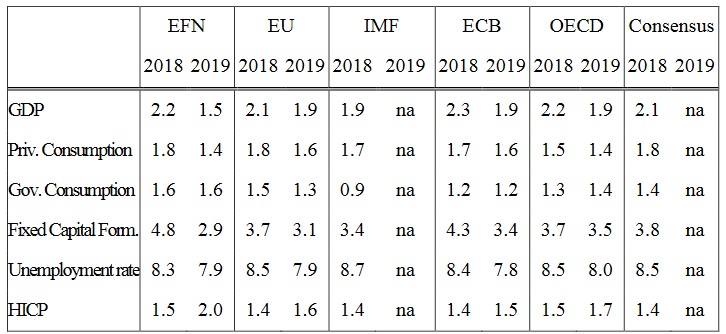
EU: European Commission, Economic Forecast, November 2017; IMF: World Economic Outlook, October 2017, ECB: December 2017 staff macroeconomic projections. OECD: Economic Outlook, November 2017; Consensus: Consensus Economics, Consensus Forecasts, December 2017. Source: EFN-European Forecasting Network (2017): EFN Report: Economic Outlook for the Euro Area in 2018 and 2019.
Euro Area Inflation Dynamics and Possible Drivers (a)
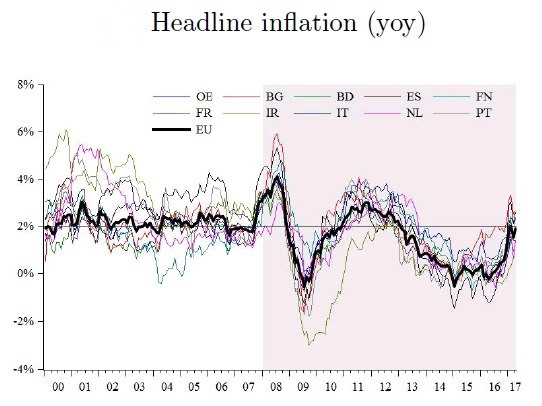
This figure (a) shows headline inflation rates in the Euro area and in ten member countries of the European Monetary Union (EMU). The possible inflation drivers may all have contributed to the low inflation rate in recent years. The series of survey- and market-based inflation expectations were obtained from Consensus Economics, Thomson Reuters and own calculations. For the remaining data sources it is referred to the data and estimation section. Source: Dany-Knedlik, Geraldine; Holtemöller, Oliver (2017): Inflation dynamics during the financial crisis in Europe: Cross-sectional identification of long-run inflation expectations. IWH Discussion Papers 10/2017, Halle Institute for Economic Research (IWH).
Euro Area Inflation Dynamics and Possible Drivers (b)
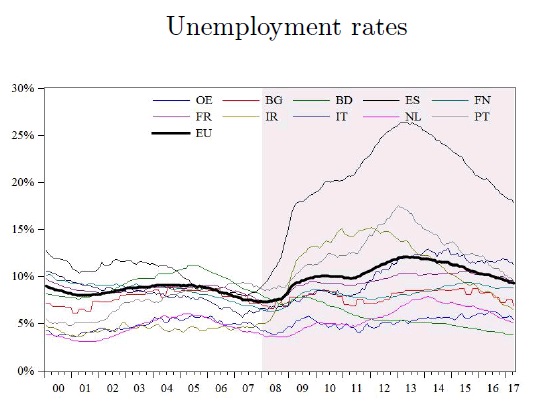
This figure (b) shows unemployment rates in the Euro area and in ten member countries of the European Monetary Union (EMU). The possible inflation drivers may all have contributed to the low inflation rate in recent years. The series of survey- and market-based inflation expectations were obtained from Consensus Economics, Thomson Reuters and own calculations. For the remaining data sources it is referred to the data and estimation section. Source: Dany-Knedlik, Geraldine; Holtemöller, Oliver (2017): Inflation dynamics during the financial crisis in Europe: Cross-sectional identification of long-run inflation expectations. IWH Discussion Papers 10/2017, Halle Institute for Economic Research (IWH).
Bank Levies Paid by German Banks
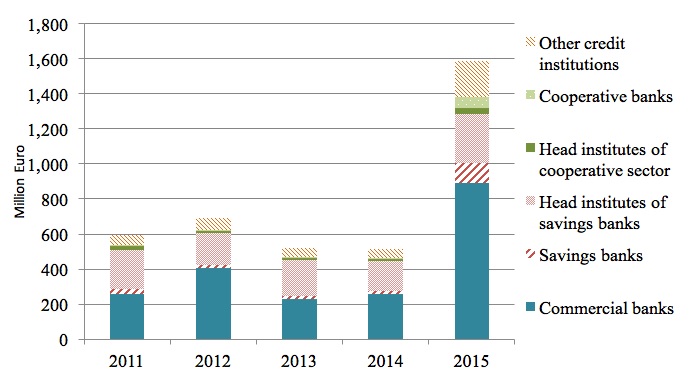
This figure shows the payments of the bank levy (in million euros) by German banks for the years 2011-2015, broken down by banking group. During the years 2011-2014, banks had to contribute to the national restructuring fund as specified in the Restructuring Fund Act. In 2015, banks contributions were for the first time calculated as specified in the Banking Resolution and Restructuring Directive. Source of Figure: Deutscher Bundestag Drucksache 18/5993, BB8/5993he 18 5 December 2015. Source: Buch, Claudia; Tonzer, Lena; Weigert, Benjamin (2017): Assessing the effects of regulatory bank levies. VOX CEPR's Policy Portal: Research-based policy analysis and commentary from leading economists.
Aggregated Foreign Funding for Brazilian Banks (2007-2010)
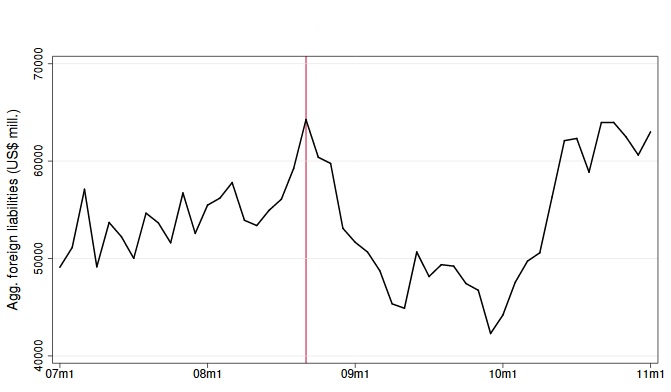
This figure shows the development of aggregated foreign funding for Brazilian banks between January 2007 and December 2010. The vertical line is set at September 2008, the month when the collapse of Lehman Brothers triggered a freeze in global interbank markets. Foreign funding is aggregated from the bank-level data in the baseline sample. The variable is reported in real 2013 US$ millions. Source: Noth, Felix; Ossandon Busch, Matias (2017): Banking globalization, local lending, and labor market effects: Micro-level evidence from Brazil. IWH Discussion Papers 7/2017, Halle Institute for Economic Research (IWH).
Unemployment Rates by Nationality (2014)
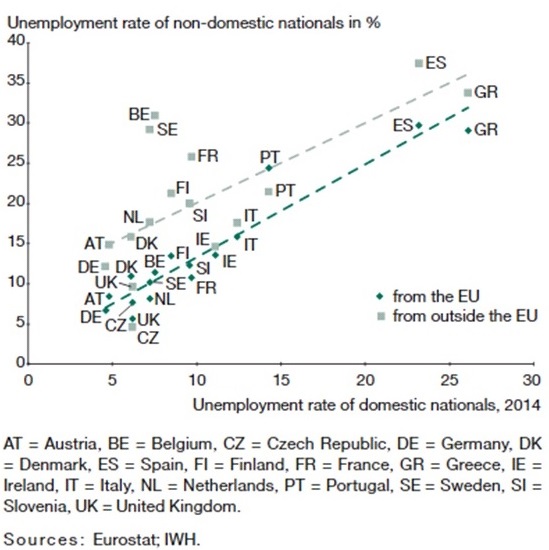
The unemployment rate of EU nationals in most countries is slightly higher than that of domestic nationals; these rates are almost perfectly correlated for all member states. As the figure displays, the unemployment rate of citizens from non-EU member states is significantly higher than that of domestic nationals in almost all countries; the dispersion of the rates is also significantly greater. Source: Altemeyer-Bartscher, Martin; Holtemöller, Oliver; Lindner, Axel; Schmalzbauer, Andreas; Zeddies, Götz (2016): On the Distribution of Refugees in the EU. In: Intereconomics, Volume 51, July/August 2016, Number 4, pp. 220-228.
Labour Market Situation for Non-EU Foreigners in Relation to the Number of Applications for Asylum (2014)
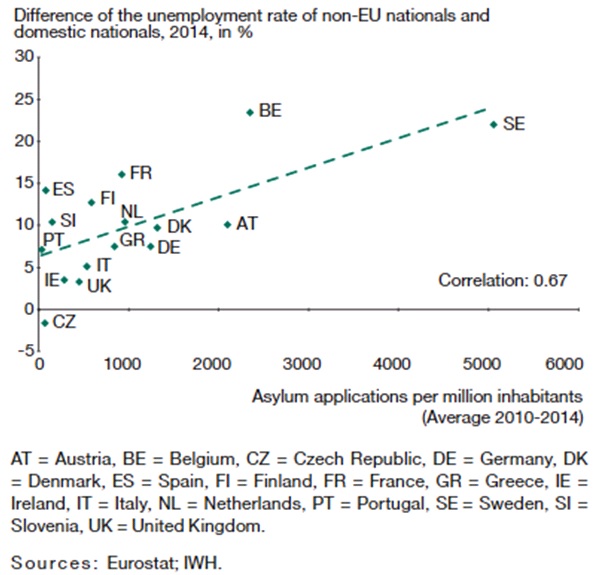
In fact, there is a positive correlation between the number of applications for asylum in recent years and the difference in the unemployment rates of domestic nationals and of citizens from non-EU member states (as shown in the figure at hand). This indicates that the marginal costs of integrating refugees do indeed increase as the number of refugees grows. Source: Altemeyer-Bartscher, Martin; Holtemöller, Oliver; Lindner, Axel; Schmalzbauer, Andreas; Zeddies, Götz (2016): On the Distribution of Refugees in the EU. In: Intereconomics, Volume 51, July/August 2016, Number 4, pp. 220-228.
Employment Rates by Nationality and Gender (2014)
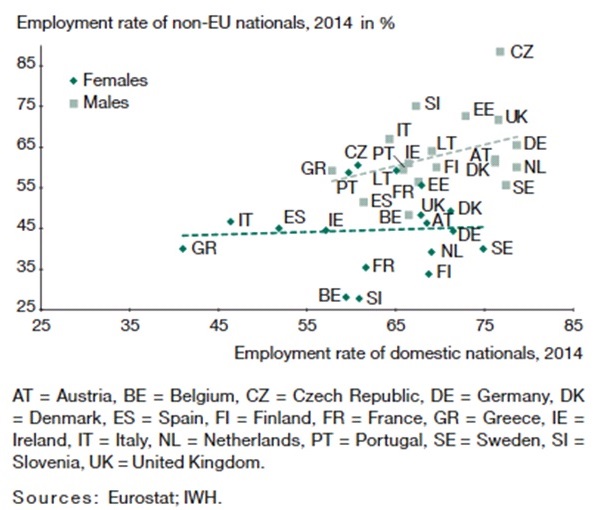
Large differences between nationals and foreigners from non-EU countries can also be observed when it comes to the employment rate. In most countries, the employment rate is considerably lower for non-EU citizens than for domestic nationals; this is the case especially for women, but it applies to men as well. While the employment rate of male non-EU foreigners increases at least somewhat with the employment rate of male domestic nationals, the employment rate of female non-EU foreigners is largely disconnected from the domestic rate (see figure above). Source: Altemeyer-Bartscher, Martin; Holtemöller, Oliver; Lindner, Axel; Schmalzbauer, Andreas; Zeddies, Götz (2016): On the Distribution of Refugees in the EU. In: Intereconomics, Volume 51, July/August 2016, Number 4, pp. 220-228.
Average Work Performance of Employees Based on Meaning of Task (2014)
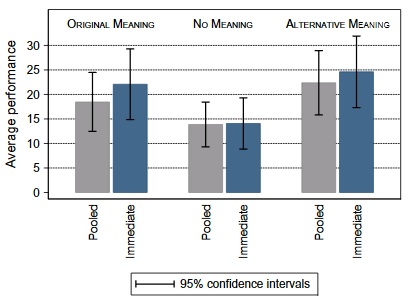
The figure demonstrates that the average number of responses differs between the three treatment groups "Original Meaning", "No Meaning" and "Alternative Meaning". It shows the average work performance of workers fulfilling the same task with the same reward but with different information about the usefulness or meaning of their work done before. Since some workers did not respond at first and only participated in the experiment as latecomers after they were sent further invitations, these were considered as a special group. Therefore, two different groups were created "Immediate" and "Pooled" and were considered separately. In essence, the additional "Pooled" group consists of latecomers grouped together with the employees that immediately participated in the experiment. Source: Chadi, Adrian; Jeworrek, Sabrina; Mertins, Vanessa (2016): When the Meaning of Work Has Disappeared: Experimental Evidence on Employees’ Performance and Emotions. Management Science 63(6): 1696-1707.
